Slicer Visual
The slicer visual intuitively allows users to set filters on data that apply to everything on the page (by default).
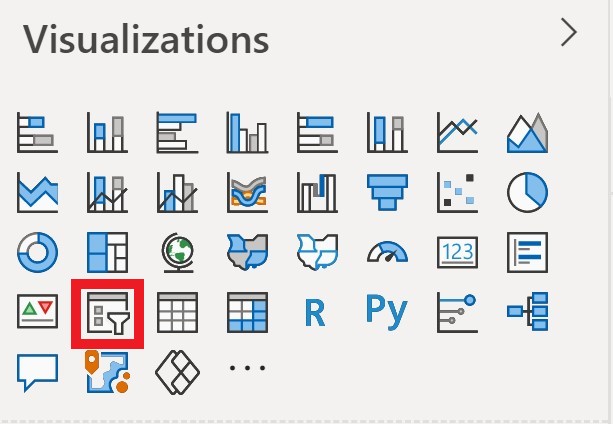
We are now going to create a slicer visual. Click on the slicer (in the red border) in the VISUALIZATIONS pane (Ensure you click on a blank space in the report page first):
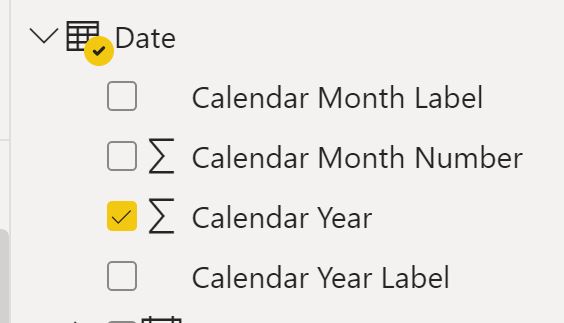
In the FIELDS pane select the table Date then the column Calendar Year.
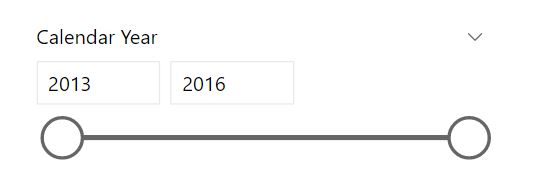
The default visual will look like this:
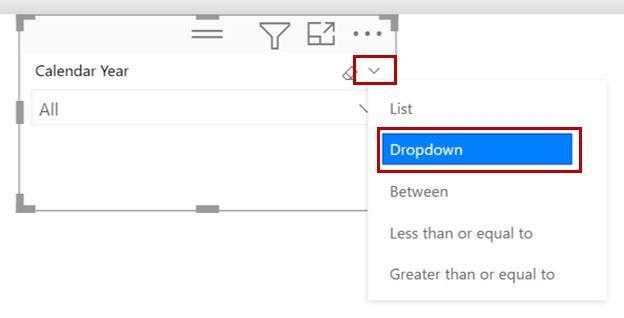
Change the slicer to a Dropdown (in red box):
Select 2016 in the slicer