Bar Chart
Select the Clustered Bar Chart Visual.

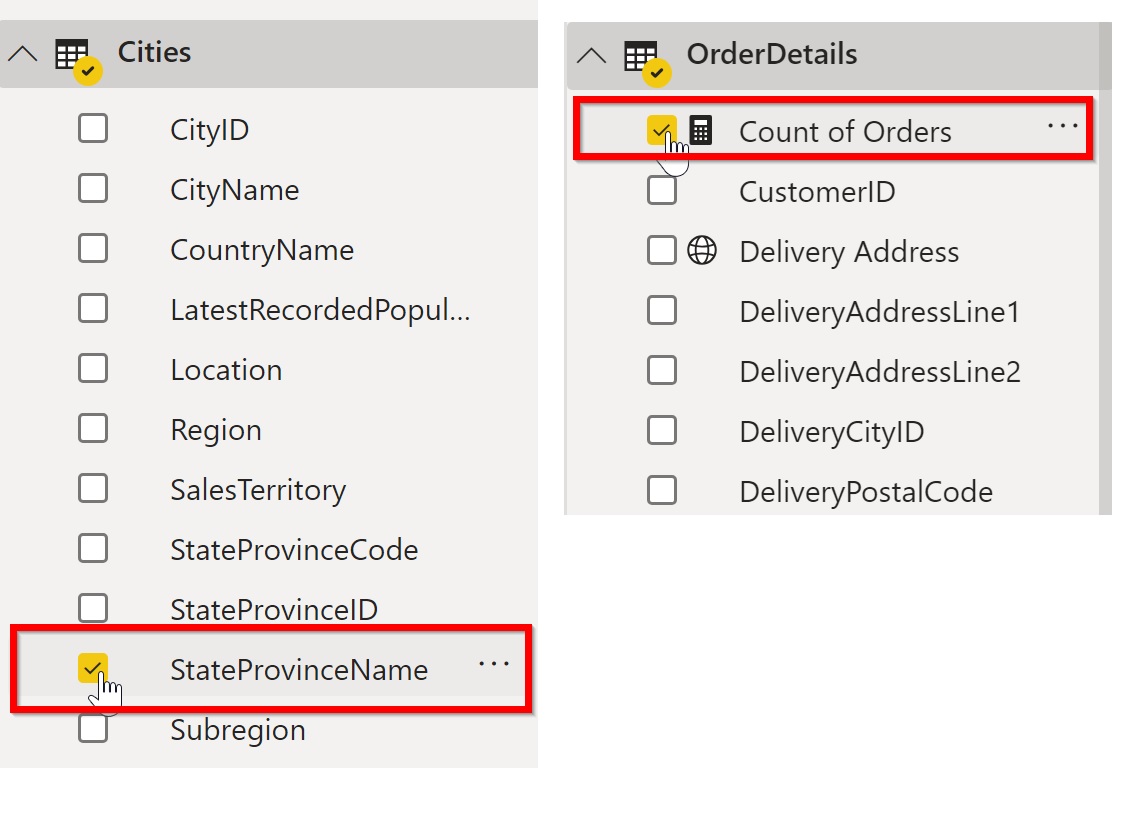
Next, use the following tables and columns (in red box) for the Bar Chart:
- Cities > StateProvinceName
- OrderDetails > Count of Orders
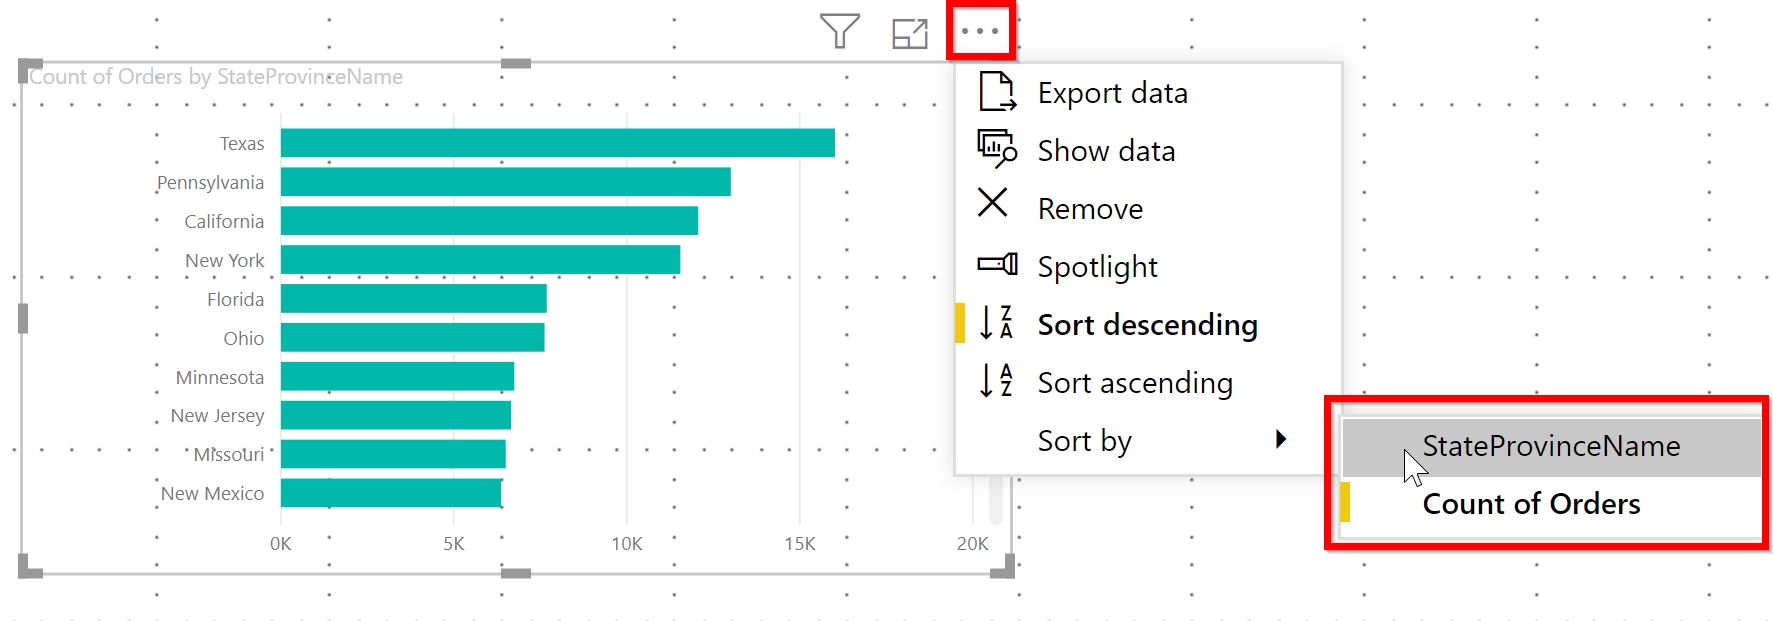
Sort by StateProvinceName. Then change back to sort by Count of Orders:
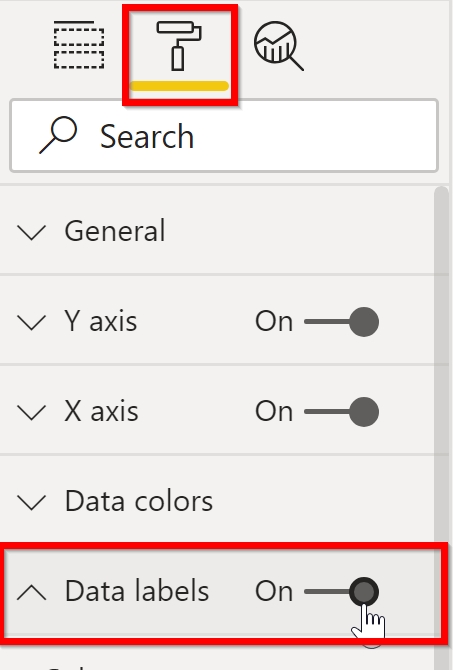
Turn on data labels by going to the format icon.
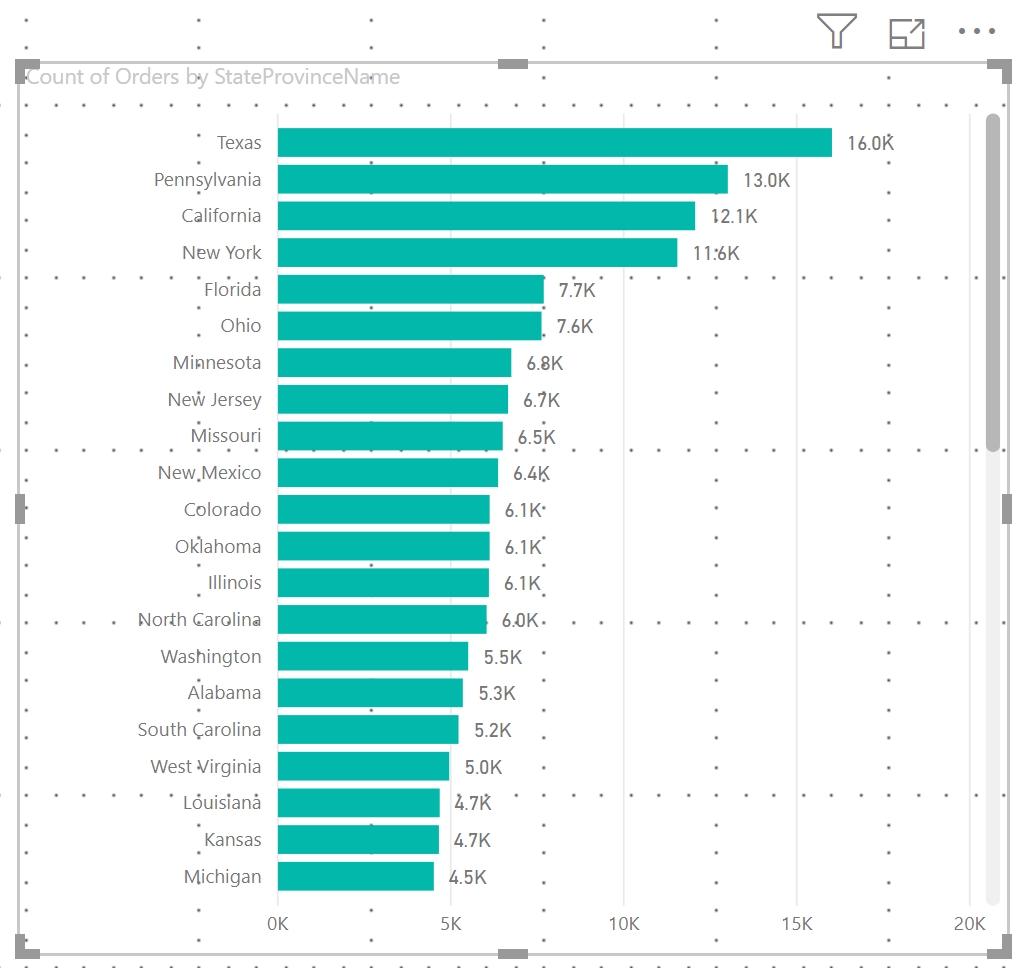
The Bar Chart should now look like this: